Halve rush hour traffic congestion
Halve the air pollution from peak time traffic congestion
Improve the health of seven million people
Sustainable reduction in road traffic accidents.
No initial or ongoing Government funding required.
The UK has serious rush hour traffic congestion.
Drivers in UK cities spent more than a day each year stuck in rush hour traffic, new research has shown. Researchers also found the overall cost per driver, including wasted fuel and working time, was £1,168.
Building additional roads does not reduce traffic congestion. See articles
Article. Article. Article. Article.
So an alternative solution is required.
Transportation engineers and planners have developed a variety of strategies to deal with congestion. The strategies can be grouped as follows:
*Adding more capacity for highway, transit and railroads;
-
*Operating existing capacity more efficiently;
-
-
-
*Encouraging travellers to use the system in less congestion-
-
-
At present commuters use cars, as their preferred means of transport, so any alternative
must have the same primary advantages. Flexibility-
Average commute length is 10 miles (Office for National Statistics).
Average speed in morning rush hour is 24mph (Department for Transport).
Safety is biggest deterrent to cycling (tfl).
Reasons why commuters do not already cycle to work.
Road safety -
Arrive hot and sweaty -
Cost of bike -
Hills -
Weather -
Unfit to exercise -
Luggage requirement -
Passenger carrying -
Road safety
Basford et al, 2002 (DfT study)
A report for the Department for Transport (2002), entitled 'Drivers's perceptions of cyclists'. This report revealed that one of the main reasons for people dismissing cycling as a genuine form of transport was fear of actual and perceived road danger.
All surveys & reports come down to the basic fear of being on a vulnerable bike surrounded by metal vehicles.
Solutions.
Bike paths & lanes -
Alternative vehicle that protected the user by legislation, so that other road users treated it equally. See below.
So the alternative vehicle must have the same advantages of a car when used for commuting
-
But for other road users to treat it equally it must be able to keep up with the
urban traffic, so a speed of 30mph is required. This is also the safest speed in
urban traffic -
Health benefits.
An electric bike provides the proven health benefits of exercise with a motor assisting
the rider -
Summary.
To reduce road traffic congestion you need to reduce car usage. Alternatives such as public transport or cycle lanes are very expensive, and will only ever appeal to a minority.
If commuters are offered an alternative that is safe, has the same advantages as a car, saves them time & money & improves their health then a large proportion will switch.
Explanation.
Government studies have reviewed the use of electric bikes but failed to see their potential to replace car usage, despite the evidence from China. Presumably this is because officials view bicycles as recreational and not road vehicles, perhaps because of their own unconscious bias.
If we take an average commute, it covers a distance of 10 miles, at an average speed of 24 mph lasting 25 minutes. So the commuter walks from home to car, sits in car for about half an hour, walks from parking place to work. If the car was replaced with a fast ebike the cyclist would get the equivalent exercise of walking for 25 minutes.
Basic human psychology is that we are lazy and prefer to take the easiest way (consider the T.V. Remote) . So looking at either sitting down and driving for 30 minutes or walking for 25 minutes the majority would opt for sitting, unless other factors were taken into account.
But one of the quirks of human behaviour is that we’re irrational in a predictable way, people are motivated by losses more than gains and prefer getting rewarded now rather than later. You can translate that into a surprisingly effective way to get people to move more, according to Patel’s study published in the Annals of Internal Medicine.
The financial benefits of ebikes rather than cars for commuting are compelling -
Cost of daily commute & parking will fall from pounds to pennies. Average car has traffic congested fuel economy of 20mpg x 10miles x £1.20pl (£5.45pg) = £3.27 per trip x2 (return journey) x 5 (weekdays) x 46 (working weeks) = £1,504.20 p.a. Average ebike battery recharge for return trip 5p x 5 (weekdays) x 46 (working weeks) = £11.50 p.a. and no parking fees.
Cost of ebike – Cycles are already available by paying monthly under the cycle to work scheme. The total purchase cost is likely to be covered by the fuel not purchased over a year.
No account of the financial benefit for replacing a car with a ebike has been factored in, as it is assumed that the commute would be by ebike and the car would be used for social usage at weekends or evenings. In a two car household the cost savings of only keeping one car would be around £2,500 p.a.
If commuters were told to sell their car and use the cash to buy an ebike this should
motivate them by fear of losing their cash if they purchased a replacement car and
reward them weekly by having virtually no fuel or parking expenses (trying to apply
Patel’s study -
This could be reinforced by the immediate health benefits, of feeling more alert when arriving at work and the usual longer term advantages of exercise.
Actions
Government to alter regulations to allow fast ebikes.
Government to change law to protect ebikes on the road, by providing a easily measurable
space around them into which motor vehicles are not allowed. -
Bike manufacturers to produce a obvious visual differential between fast ebike &
other cycles -
Cycle insurance -
Notes.
In 2014 the UK Government drew up a plan to invest £214m to promote cycling (Deputy
Prime Minister’s Office, 2014) -
Existing European & UK law -
Response from the Department of Transport
“Nor is it clear that allowing ebikes to travel at 30mph would have safety benefits” –factually incorrect as studies prove that if road users are travelling at the same speed that the level of accidents decrease. See below
“particularly since accidents at that speed would have serious consequences for the
rider and others” – other than the fact that bicyclists are already travelling at
30mph (although they are unable to sustain this speed in traffic) studies have shown
that Any shift from motor vehicles to e-
WHY 30 MPH
Why I feel that going faster, on a bicycle, is safer.
To prove that, up to the speed of surrounding traffic, faster is safer. Let us try a mathematical approach.
For ease of math -
At 10 mph -
At 15 mph -
At 20 mph -
AND, cars have twice the time to notice, and avoid, you! (vs 10 mph).
At 25 mph -
At 30 mph -
(Math is simplified -
When you consider that many bike accidents are directly related to passing cars,
especially in a "road" environment, then 20 mph would be (4 times safer than 10 mph)
x (2 -
Most impressive is that each speed increase of 5 mph reduces the volume of passing traffic by 50%!
Idiot factor! Everyone might agree that, possibly, 1 in 100 motorists are dangerous drivers, Going 10 mph you'll get passed by 4, only 1 @ 20 mph and at 30 mph you might never encounter one.
Also the impact of a car is lessened with the faster you are travelling. The only deciding factor is how much more the ground hurts at 30 MPH vs 15mph.
A very important formula involved in the math of speed is k=(1/2)mv^2. The kinetic energy increases in proportion to the square of the speed. (k is the kinetic energy, m is the mass, and v is the speed of the bike.
Biker at 10 mph vs 20 mph in a 30 mph traffic situation.
Per mile -
1. passed by 4x (times) as many vehicles =
a. 4x the possibility of hit, or swipe x (2x impact speed)
b. 4x the possibility of "right cross" **
2. 2x the volume of oncoming traffic =
a. 2x the possibility of "left cross" **
b. 2x possibility of head on x (.8 impact speed)
(30 + 10 mph vs 30 + 20 mph = 80% impact speed)
3. 2x the volume of cross traffic, sidestreets, driveways etc. =
a. 2x the possibility of cross traffic collision **
Twice as long, being a target, in the intersections!
Note: Actual percentages listed where available. Other impacts are highly variable due to possible angle and bike into vehicle or vehicle into bike.
** Speed, or severity, of impact will vary, from 50% to 100% (possibly higher).
Best case is 50% impact speed of 10 mph biker into side of vehicle.
Worst case would be, side impact of biker by car, 100% impact speed. Possibility of being "run over" might be 2x, for the 10 mph biker. (Momentum of 20 mph biker is much more likely to carry him past the car = much greater chance of not being under car!)***
(Same direction impact already established at 4x possibility & 200% speed-
*** 20 mph Biker possibility of impact is approx. 25% to 50% that of the 10 mph Biker.
Additionally, 20 mph Biker is 2x as likely to strike the vehicle while the 10 mph
Biker is 2x as likely to be struck by vehicle. (Applicable to all, except same direction
& head-
The final, measurable, variable might be, "time to see", (tts), the biker. (10 mph biker) While following traffic only has .5x the tts, oncoming traffic has 1.25x the tts, and the cross traffic has 2x the tts.
The additional factor of faster motion being more noticeable, especially in the peripheral vision area, should be added, but, I'm afraid, assigning percentages would be sheer speculation.
(Peripheral vision is much more attuned to detecting motion, as well as light, especially flashing light. Another good reason for a "strobe" headlight, during the day.)
With higher speed traffic, is where the most concern about passing vehicles exists. How does speed effect your risk in a 60 mph traffic situation.
For ease of math -
At 10 mph -
Driver has 7 seconds to notice & accommodate biker.
At 15 mph -
At 20 mph -
Driver has 9.5 seconds to notice & accommodate biker. Cars have approx. 1.4 times the time to notice, and avoid, you! (vs 10 mph).
At 25 mph -
24min x 10 cars -
At 30 mph -
Driver has 12 seconds to notice & accommodate biker.
(Math is simplified -
When you consider that, in "open road" conditions, most bike collisions are directly related to passing cars, then 20 mph would be (2.5 times safer than 10 mph) x (1.4, the time the, approaching, driver has to see biker) = nearly 4 times safer @ 20 mph, compared to 10 mph!
30 mph would be (5 times safer than 10 mph) x (2, the time the, approaching, driver has to see biker) = 10 times safer @ 30 mph, compared to 10 mph!
Note: Some of the math is approximated, fairly accurate, but will modify if deemed necessary.
Most impressive is that every bit of speed increase greatly reduces the volume of passing traffic and therefore increases the safety factor!
Everyone might agree that, possibly, 1 in 100 motorists are dangerous drivers, Going 10 mph you'll get passed by 5, only 1 @ 30 mph.
Any direct impact by a car will, (almost), instantly accelerate a biker to, (very near), the vehicle speed, regardless of biker speed, or direction.
Math based on rear impact, at various speeds
C=Car
B=Biker
"Result" is the, post impact, resulting speed for car & biker both.
3000lb C (30mph) vs 150lb B (stationary) = 30mph impact = 28.5mph result
Initial impact comparable to fall from roof of 3 story building, onto hard car
Damage=probable broken bones, severe internal & head injuries etc.
3000lb C (30mph) vs 150lb B (10mph) = 20mph impact = 29mph result
Initial impact comparable to fall from roof of 2 story building.
Damage=possible breaks, internal injuries, concussion etc.
3000lb C (30mph) vs 150lb B (20mph) = 10mph impact = 29.5mph result
Initial impact comparable to fall from roof of 1 story building.
Damage=possible sprains, bruises etc.
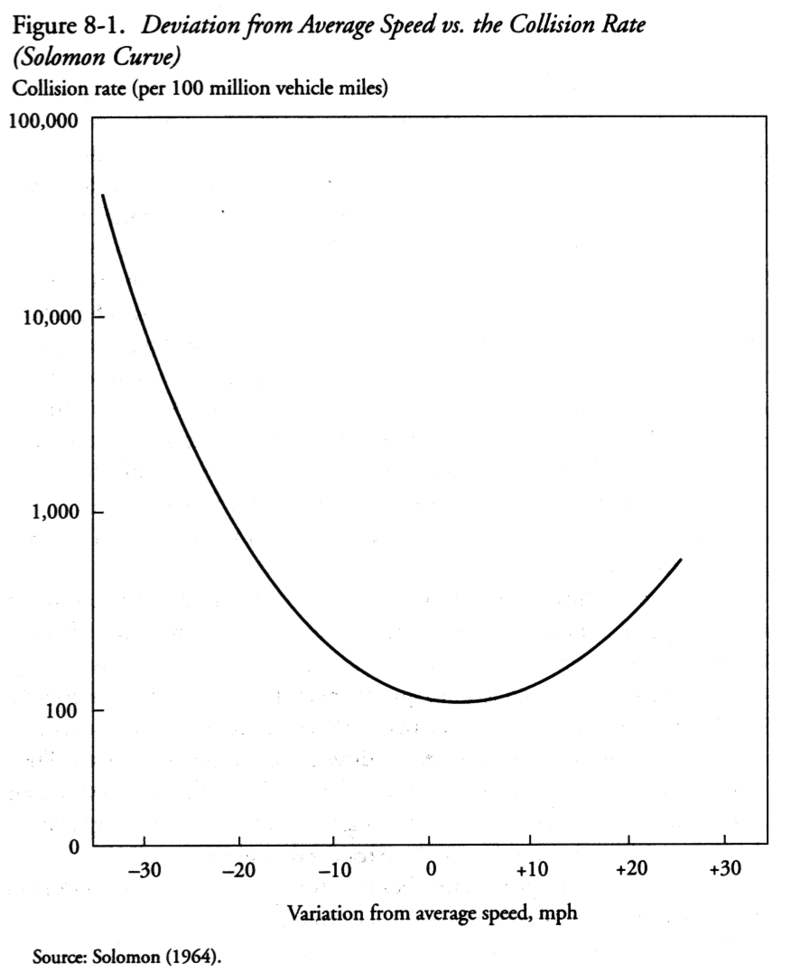
The probability of being involved in a crash per vehicle-
Collision rate would appear to be 20-
This shows that if you ride at traffic speed, you are less likely to have an accident.
It also shows that riding slower than average traffic speed is more dangerous than riding faster.
Fall = Impact speed -
"A fall off a 3.3 feet desk results in a speed at impact of 10 m.p.h.
A 10 m.p.h. change in speed (Delta-
Similarly,
a 15 m.p.h. change in speed is equivalent to falling 7.5 feet -
A 20 m.p.h. change in speed is equivalent to falling 13.4 feet -
A 25 m.p.h. change in speed is equivalent to falling 20.5 feet -
A 30 m.p.h. change in speed is equivalent to falling 30 feet -
A very relatable impact speed analogy -
The injury risk for cyclists involved in motor vehicle collisions at various impact speeds can be approximated by considering pedestrian injury risk curves (Cycling Safety Panel 2014). The rate is not a constant curve but increases dramatically from 55 kph (35 mph)
safety is improved when the user is able to keep up with traffic rather than being constantly overtaken. A faster bicycle helps riders ‘claim the lane’ in roundabouts and wherever there is insufficient lane width for sharing with a motor vehicle
45 km/h (subject to additional restrictions not applicable to pedal cycles in general)
would enable users who want to travel faster but still to cycle (as opposed to just
riding a moped), to ride S-
ROAD SAFETY
The safety of cyclists is inextricably linked with the number of people cycling. This is generally considered to be because of “safety in numbers” – in other words, an increase in people cycling directly reduces the risk of injury per cyclist. Comparisons between countries and cities show that places where there is more cycling have a lower risk of injury
Car drivers pass closer to cyclists wearing helmets.
Bosch Launches ABS for Pedelecs
Honda shows off self-
electrical bicycles are not always clearly distinguishable from traditional ones. As a consequence, it may not be obvious for other road users, (e.g. a driver at an intersection), to estimate their speed (e.g. when deciding to cross the bicycle path)
Pedelecs are, with regard to their design, hardly distinguishable from conventional bicycles. Simple measures that mainly aim at increasing cyclist visibility do not seem to be suitable to change gap acceptance and speed judgement of pedelecs. The results indicate that observers base their speed judgements and turning/crossing decisions on their experience with conventional bicycles. Therefore it may be more appropriate to develop a unique pedelec design to clearly distinguish it from a conventional bicycle.
Why an ebike can be safer than a normal bicycle.
Choosing safer routes, also an ebike can more easily ride in the middle of the lane, because he/she can keep up much better with the flow of traffic (in heavy traffic, cars can rarely drive much faster than an ebike).
With an ebike you can be more cautious and brake more often (when you need to), knowing that, in just a few metres and with no great effort, you will soon reach a high speed again. Less fatigue = more alertness.
Little evidence has been found to suggest that cyclists are safer on paths than on roads.
Ebikes are not Dangerous: This Research Proves It Electric bikes are not involved
in accidents more often than regular bikes.The higher average speed of S-
Despite their higher average speed, s-
Risky cycling rarely to blame for bike accidents, study finds
The data, which was analysed by the Transport Research Laboratory (TRL), showed that
more than a quarter of all cycling deaths in 2005-
What Are the Most Common Causes of Cycling Accidents?
According to the Royal Society for the Prevention of Accidents (ROSPA), every year around 19,000 cyclists are injured in UK road traffic accidents. (2015)
The figures include the 3,000 cyclists who are killed or seriously injured each year, but only include the cycling accidents that are reported to the police.
According to the Department for Transport (DFT), 109 cyclists were fatally injured and more than 3,000 suffered serious injuries in 2013.
The majority of cyclist casualties are adults, with men far more likely to be involved in cycling accidents than females. Four out of five cyclist casualties are male and most cycling accidents occur in urban and built up areas.
Almost two thirds of cyclists who are killed or seriously injured are involved in
collisions at, or near, road junctions. T-
Around 80% of cycling accidents occur in daylight with the peak commuting hours, 8:00 to 9:00 am and 3.00 to 6.00 pm, the most dangerous. Cycling accidents that occur at night are more likely to be fatal.
Cycling Accident Statistics
75% of fatal or serious cycling accidents occur in urban and built up areas
50% of fatal cycling accidents occur on rural roads
75% occur at, or near, a road junction
80% of cycling accidents occur in daylight
80% of cyclist casualties are male
75% of fatal cycling accidents involve major head injuries.
Types of Cycling Accident
Adult cycling accidents are more likely to involve a collision with a vehicle, but around 16% of fatal or serious reported cycling accidents are caused by the rider losing control of their bicycle.
Cars and taxis were responsible for the majority of cycling accidents involving collisions with vehicles, and cyclists were predominantly struck from behind by the front of vehicles.
Accident Contributory Factors
Collisions between cyclists and vehicles are most commonly attributed by the police to a “failure to look properly” by either the driver or the rider, especially at junctions. “Failed to look properly” was attributed to the car driver in 57% of serious collisions and to the cyclist in 43% of serious collisions at junctions.
The second most common contributory factor attributed to cyclists was “cyclist entering the road from the pavement.” This accounted for 20% of serious collisions involving vehicles and included times when cyclists used pedestrian crossings to cross roads.
Other common contributory factors attributed to drivers following collisions with cyclists, included drivers executing “poor turn/manoeuvres,” drivers being impaired by alcohol, driving carelessly or “travelling too fast for the conditions,” failing to correctly judge a cyclist’s speed or path, and overtaking too close to cyclists.
Around 25% of serious cycling accidents involve a heavy goods vehicle (HGV), bus or coach “passing too close” to the cyclist. HGVs present a particularly dangerous threat to cyclists, especially in built up urban areas. Although HGVs make up only 5% of the UK’s road traffic, they are involved in 23% of all cyclist deaths, typically when an HGV is turning left at a junction.
Additional factors blamed for cycling accidents included defective and uneven road
surfaces, loose debris, and potholes -
Is cycling really that dangerous?
No. In general, cycling in Britain is a relatively safe activity.
These findings have relevance to bicycle and e-
that e-
Crashes with electric bicycles are about equally severe as crashes with classic bicycles.
Cycling Accidents-
Walking and cycling statistics 2018
The Highway Code -
Average uk commuter journey length is 10 miles (Office for National Statistics).
Study finds electric bikes faster than cars for most journeys – they’re faster
than cars for journeys up to 10 km with the difference being marginal all the way
to 20 km (12 miles). No data was presented for fast electric bikes that assist up
to 28 mph. http://www.50cycles.com/blog/electric-
An earlier study by J L Radtke that found pedal-
Health Benefit of Electric Bikes: Health Benefits Resulting from Sustained Aerobic Exercise.
Researchers have proven beyond dispute that exercising is the best thing we can do for our health – so much so that scientists have called exercise a miracle cure for the diseases that kill most of us, including heart disease, diabetes, cancer and depression (Academy of Medical Royal Colleges. Exercise: The miracle cure and the role of the doctor in promoting it).
A study entitled “Pedelecs as a physically active transportation mode,” published in Eur J Appl Physiol., reported on the health benefits to sedentary people who started riding ebikes. Most participants were found to have cycled more than required, with several having biked about 50 percent more. This is of course attributable to the “fun factor” of ebiking. Participants reported that the ebike riding was “a blast.” William Byrnes, the study’s senior author, noted: “It’s exercise that is fun.” And as we all know, the key reason why most people give up on exercise programs is simply because most exercise programs are not fun.
Similar results were achieved in a study in the UK, where 40 Bupa International employees
were loaned ebikes for up to 8 weeks. Most cycled more than they had before, and
researcher Dr. Sally Cairns noted that: “The proportion of participants who said
they would cycle to work at least one day a week rose from 30% to 75% if they had
an e-
In yet another study, this time at the University of Agder in Kristiansand, Norway, researchers were similarly skeptical about the aerobic benefits of ebiking, so they hooked participants up to portable oxygen analysers linked to a GPS as they rode both regular bikes and ebikes. The rides were designed to simulate bike commuting to work. The researchers were focused on the crucial need identified above – moderate exercise. They noted: “Health officials recommend moderate or intensive activity at least 150 minutes per week. Moderate activity is defined as three times a person’s resting metabolic rate, in other words three times as much as when we are lying still.” (Source: ScienceNordic)
Their research showed that all of the cyclists were moderately active most of the
time. The people on ebikes were 8.5 times as active as when they were resting; while
the people on regular bikes were 10.9 times as active. Those on ebikes used an average
of 51% of their lung capacity; while those on regular bikes used 58% on average.
This difference was smaller than the researchers expected, and certainly confirmed
that the ebikers were meeting the recommended levels of moderate exercise for promoting
good health. Prof. Elling Bere stated: “The conclusion is that e-
It appears that people who have electric bikes spend more time riding them, than
do people who have regular bikes. For example, a study in Norway showed that ebikes
cause people to cycle longer and more often – especially woman. Aslak Fyhri at the
Institute of Transport Economics summarized: “People travel twice as much on the
electric bike [as on a regular bike], both in terms of kilometres, amount of trips,
and as part of the total transportation. The effect of having an electric bike was
particularly strong among women. They did far more trips with their e-
Health Benefit of Electric Bikes: Strengthening Muscles, Bones, and Joints
Ebikes are substantially heavier than normal bikes (usually weighing in at anything from 40 to 80 pounds). For this reason, steering, pedaling, and balancing an electric bike provides strengthening exercise that promotes healthy and strong muscles, bones, and joints. “Joint conditions such as osteoporosis, osteoarthritis and chronic lower back pain affect a majority of Americans today, all of which can lead to an increased risk of fracture, pain, disability or deformity. Physical activities, such as riding an electric bike, are a safe and readily accessible way of improving bone strength and reducing the risk of osteoporotic fractures.” (Source: 3 Surprising Health Benefits of Riding an Ebike) Your core strength will also increase noticeably as you regularly use your core muscles to balance your electric bike.
In sum, electric bikes offer a range of impressive health benefits. They are simply
one of the most effective and enjoyable ways to get the moderate exercise we need
to preserve our health. If you are not already enjoying the benefits – what are you
waiting for? Yes, a decent ebike will cost money, but the value of health is incalculable.
http://electricbikeblog.com/5-
Participants rode a pedelec in the real world at a self-
Exercise is necessary in our lives, as we all know by now. People who are physically active are much less likely than sedentary people to develop heart disease, diabetes, cancer, stroke, depression, disabilities in old age, or to die prematurely.
But statistics show that, despite its benefits, a majority of us never exercise. When researchers ask why, most people offer the same two excuses — they don’t have time to fit exercise into their lives or they aren’t fit enough to undertake exercise.
Potentially, electric bicycles could address those concerns. Their motors shore up your pedaling as needed — or, with some electric bikes, do the pedaling for you — making climbing hills or riding for long distances less taxing and daunting than the same ride on a standard bicycle.
In the process, they could make cycling a palatable alternative to commuting by car, allowing people with jammed daily schedules to work out while getting to work.
Health benefits of electric bikes research
Ebike users experience increased health and well being
No difference between using a cycle or ebike
A study found that markers of intensity (METs, VO2, power output, and heart rate)
were not different between the electric pedal assist mode trials and the non-
Same Great Workout, Just Faster and More Fun
Intuitively, you would expect that there would be less physical fitness benefit to riding a bicycle that is partially propelled by an electric motor than riding one without a motor, in other words a standard manual bicycle. In that assumption, you would be wrong.
Riding an Electric Bike is NOT Cheating. Here’s the Data to Prove It
“Moving to the eBike added almost 7 mph to my ride. My body worked the exact same but for a shorter duration.” The gains showed up in other places, as well. “The five day commute felt more sustainable and freed up more time with family. Still, the 10.5 hrs of intensity each week is plenty to keep me in really solid fitness shape.”
physical activity implications of electric bikes
e-
Cycling on the E-
Electric bikes make people cycle longer and more often, a new study concludes, adding that the effect is best on women. A new study focused on how people use the electric bike and how the electric bike may contribute to a decrease in motor traffic.
Study indicates electric cycle more often and for longer distances
According to a new experimental study, those with access to an electric bike cycle farther and more often than those who use a regular bike. Men cycle farther while women cycle more often.
A Dutch study published in the January 2011 issue of the journal "Epidemiology" calculates
that cycle-
A Dutch study found -
Study indicates electric bikes increases frequency of cycling
Ideas
For anyone who has travelled during the rush hours on the roads we know that Britain has a major problem with vehicle congestion, but the received wisdom is that the Government has neither the money to build more road capacity nor our towns the space required for additional roads. So the gridlock continues because neither the Minister nor civil service will consider a different solution. The view is reinforced by studies that show when new road capacity is created that very soon additional traffic exceeds the initial anticipated demand.
A solution is however not only technically possible but will not cost the Government any money, will reduce traffic congestion, provide a sustainable reduction in road traffic accidents, improve air quality, provide health benefits to millions of commuters as well as reducing their daily commuting time & substantially reduce their costs.
The proposal is very simple. Remove the restriction on electric-
Indeed anyone can sit on a bike, push it downhill & go faster than 30mph. Bikes have been on uk roads in significant numbers since the 1890s and no legislation has restricted their speed, apart from abiding by Road Traffic speed limits. So I do not understand the reason why it’s ok to allow an electric bike to travel at 15mph but not 30mph.
The primary reason why I would allow an increase to 30mph is road safety, as if all vehicles on urban roads are travelling at the same speed then accidents will be minimised. It also has the advantage of providing the benefits necessary to entice people from using their cars to commute, through a quicker journey time (higher average speed) as well as substantial fuel & parking cost benefit, improved health, reduced pollution & traffic jams.
But the status quo is not working as people can already use mopeds, but they are choosing to remain with their cars. The solution must be easy for people, with none of the parking complications & tax & insurance costs involved with electric mopeds (which do not provide the health benefits of moderate exercise obtained from pedal assisted electric bikes).
I would wish that the Government should announce the increase to 30mph through a marketing plan via a press release, and not government advertisements. The press release should be sent to all uk newspapers, magazines & live tv & radio programs. This will create the buzz needed to get the impact of the change across, whereas advertisements do not have the time to fully explain the benefits.
The Press Release:
The government is raising the speed limit on electric bicycles to 30mph, in order to reduce traffic congestion, improve air quality, improve road safety and improve the health of the nation.
The primary reason why commuters do not travel by bike is safety. Which is understandable when cycles wobble along at 15mph hugging the left hand side of the road. No more, instead the ebikes will speed along at the 30mph speed limit safely in the middle of the road. There is no reason for them to keep left as they will be doing the maximum speed limit. Indeed its safer, as around 600 cyclist a year are injured by car doors being opened. Also the present impossible to police offence of passing a cyclist too close will be replaced by a ban on overtaking on the same side of the road, so for roads with central white lines, a car will need to be wholly on the opposite carriageway to safely overtake. This will be policed by cyclists cameras, uploaded to a central site. As all vehicles on the road will be travelling in the same direction & speed the chances of accidents are reduced dramatically, with the need for vehicles to overtake bikes removed.
The benefits for commuters of switching to cycles are time saving, health improvement & cost benefit. 57% of commuters use their car, with just 5% as passengers. So 52% are sole drivers.17 million workers commute, so a target of one half of 15 million sole drivers = 7 million. Average commute length is 10 miles (Office for National Statistics). Average speed in morning rush hour is 24mph (Department for Transport). Safety is biggest deterrent to cycling (tfl). Using an ebike will allow quicker journey times with a higher average speed as with same maximum 30mph speed limit the bike will not get caught in queues but go straight to the front & will be able to drive on rat run streets restricted for cars. So commuters using bikes will have a shorter journey time, & will not have to use their leisure time to go the Gym.
As they will be doing moderate physical activity twice daily during the working week, their physical health will be improved. It is more beneficial to have regular moderate activity than occasional strenuous exertions.
Increased alertness at work, having arrived after a light exercise, as opposed to being slumped in the driver’s seat & stressed at being caught in traffic.
The benefits to society are reduced rush hour traffic congestion, with consequent reduction to road maintenance, and improved quality of air through reduction of the highest polluting type of traffic, slow, rapid acceleration followed by braking, namely congested vehicles with cold engines doing relatively short journeys.
Notes.
Objective.
Transfer 50% of road commuters from motor vehicles to electric bikes within 5 years.
Department of Transport – should be given ownership of the target of say 10% pa for 5 years. No additional funding as no spending required, but reduced car usage at peak times will reduce road wear and so need for road repairs. In order to motivate officials the total departmental budget & any performance bonuses will be reduced by the same percentage as failing to achieve the 10% yearly target.
Energy Saving.
A 1000w (1hp) electric cycle. Existing average saloon car has 100hp whether it’s an internal combustion engine or electric drive, so will use approximately one hundred times the energy, as its needs to move the weight of the car, whereas the cyclist will only be assisted by his motor & will be using his own muscles to pedal.
Objections
Motor lobby -
Oil industry -
Civil Service -
The Treasury. – The proposed increase use of electric power will reduce the fuel duty etc, so a road pricing scheme will be needed to replace the lost revenue. As bikes are not regulated they will be impossible to tax, so treating them as mopeds allows continued taxation.
Can't as need to agree a pan European law -
Why not follow europe’s s-
Politicians -
Health & safety – An increase to the speed of ebikes has not increased the number
of accidents. Despite their higher average speed, s-
Helmets -
Bike Safety -
Revised Road Traffic legislation. On urban roads cars are prohibited from overtaking fast ebikes, except by using the opposite carriageway. Also to ensure that drivers pulling out in front of fast ebikes allow sufficient room, if the cyclists camera can record the car registration number then the car is too close. Both of these rules are simple to follow & easily provable, unlike the existing legislation.
Self Regulation -
Pedestrian danger – As bikes will be going faster they will not be allowed on cycle paths (combined footpath/cyclepath) but restricted to cycle lanes on the road and full access to the urban road network.
Poor Weather – Wet weather clothing for a ebiker keeps them dry without getting sweaty. This works for rain or snow. For ice consider the self stabilising device announced by Honda.
Perception by drivers of cycling.
Slow -
unsafe-
dirty -
cold & wet -
Sweaty-
Psychology of car drivers
Most drivers want to complete their journey from A to B without any delay along the route. When driving a car the behaviour of people changes, as they become more aggressive & insulated from other road users, within their metal box. If a slow vehicle impends their progress drivers will attempt to overtake it, but their actions differ based upon their sight lines, not speed of the slower vehicle.
So if a tractor with trailer is in front, the view of the road ahead is blocked & drivers will leave a large gap to edge out to see around the tractor. Unfortunately with a cycle, even if going at a greater speed the driver is able to see past the cycle, and so treats it as an obstacle and not a slower moving vehicle. As such they will try to squeeze besides a cycle even with oncoming traffic, rather than follow the highway code & overtake it using the opposite carriageway.
The above is SMART -
Electric Bikes and Carbon emissions
A European Cyclist Federation study concluded that after factoring in CO2 emissions
produced during electricity generation, an e-
The above are my ideas and I wonder if you are able to provide any assistance, through technical review and criticism, to improve them and suggestions as to how to lobby the government.